The US consumer price inflation report showed prices fell 0.8% month on month in April, dragging the annual rate of inflation down to just 0.3% as gasoline prices plunged more than 10%. However, the bigger news is that core inflation (excluding food and energy) has recorded consecutive MoM declines for only the second time in the series’ 63-year history – the last time was 1982.
Why are we facing deflationary pressures in our economy? Especially when the US Federal Government has injected trillions of dollars into the economy in recent months?
Shouldn’t fiscal stimulus be inflationary? You are adding money to the system after all.
To answer these questions, let’s start with the concepts of inflation and deflation.
What is inflation?
You are probably already familiar with the concept of inflation. Real quick, inflation is a sustained increase in the price of goods and services through time.
Inflation occurs as a country creates more of their currency over time. This money printing means that each additional unit of currency becomes less valuable. As a result, you have to use more units of that currency to purchase some good or service.
During inflationary times, you don’t want to hold cash. Holding cash during inflation is like holding a depreciating asset which loses value every day.
Instead, you want to invest that cash in some asset that will appreciate in value during inflationary times, such as gold.
Now on to deflation…
Deflation occurs when there is a high demand for cash. Contrast this with inflation, in which there is a low demand for cash.
Some economists may disagree with this. But you have understand that deflationary pressures were at their worst coming out of the 2008 recession and now during this current recession we are in. These deflationary issues emerged as a result of the emergence of central bank interventions and the rise of the carry trade. More on that in a second.
Why is there a spike in demand for cash?
Volatility (or the price of money)
Volatility (which can be generalized to the VIX, due to the liquidity and vast usage of SPX as a proxy for all market volatility) can be understood as the price of money. How exactly?
Volatility in the market during a carry regime causes deflationary forces to take hold. The reason for this is as follows:
When volatility is high, seemingly safe investments appear (or even become) less safe investments. This effect decreases the moneyness of those assets (or how safe those assets are viewed with respect to cash). As a result, cash becomes king.
Cash becomes king due to margin calls or other risk-based rebalancing factors, which can lead to hard selloffs in assets of all varieties as the rush to cash becomes more common.
Rapid deflation is the result
Rapid deflation occurs as a result of this spike in demand for cash. Cash becomes more valuable to market participants during this time. This is due in part to uncertainty about future asset prices and other factors which exert downward pressures on those assets.
Without central bank interventions, you can end up in a situation of runaway deflation. Too many market participants chasings cash at the same time is going to push asset prices down. There is no way around this.
This is why in volatile markets, asset correlations tend to converge. All assets lose value due to margin calls and other factors mentioned above.
Just like a run on the bank, except with no bank
One way you can think of this scenario is just like a run on the bank, except there is no physical bank per se.
The limiting factor is how much cash is currently available in the system, how much central banks will allow the value of other assets to drop, and subsequently how much liquidity (cash) central banks will be willing to inject into this system.
Want proof? – Check out various markets in early March when selling was high

Remember the selloff in equities that took place near the end of February and beginning of March. A situation was created where there was a sudden dash for cash.
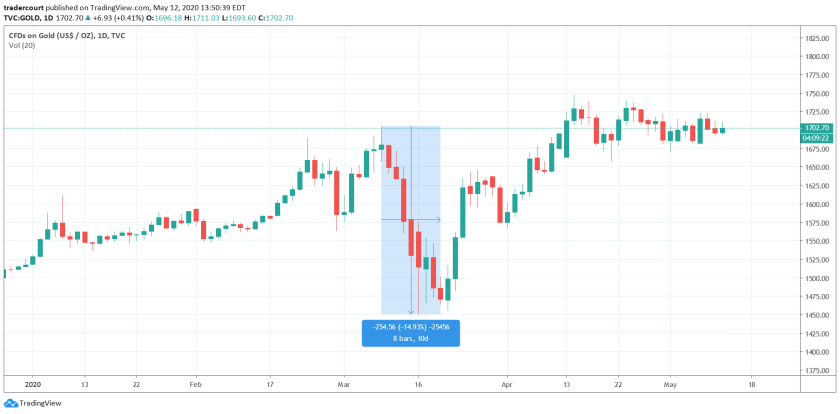
Gold prices exploded higher, then plummeted. Why else would gold prices collapse in the face of economic uncertainty in conjunction with insane printing by Central Banks?

Treasuries also sold off after hitting historic highs in price (lows in yields).

Even Bitcoin lost 50% of its value during early March.
Why? Because many different market participants began dashing for cash. This created an environment where there were fire sales going on across assets.
Why deflation though?
As our M2 money supply increased in recent decades, there has been an associated decrease in the velocity of that money.

The above chart shows the M2 money stock in red, which has increased significantly since 1990. The chart also shows the velocity of the M2 money stock, shown in blue.
Both of these values are indexed to January 1, 1990 as the starting point. While the M2 money supply has increased significantly, the velocity of that money has actually decreased steadily through time.

If you look at these values with both being indexed to June 1, 2015 you can see a drastic difference in the direction of the M2 money supply and the velocity of that M2 money.
This chart doesn’t even include the velocity of the M2 money supply recently injected into the financial system in March and April 2020. You could expect that this figure has declined significantly.
What is the velocity of money?
The velocity of money measures the rate at which money is exchanged through the economy.
It is usually measured as a ratio of GDP to M2 money supply (in our case here).
High money velocity is a sign of a strong, healthy, expanding economy. Low money velocity is associated with recessions and contractions in the economy.
Low velocity of money means that for every new dollar being created, it’s not making its way into the real economy.
This is pushing on a string as Ray Dalio has called it, and is a signal that additional stimulus actions by the Federal Reserve have become less effective at stimulating the economy.
How is the carry regime responsible for this?
The carry regime is associated with underlying pressure towards deflation.
In the book, Rise of Carry (affiliate link*), the carry regime is associated with the following traits emerging in the economy:
- High debt burdens
- Limited economic growth
- Low prospective returns to real investment (low- to zero-interest rate policies)
Debt burdens rise during this regime. This is due to the continuing decrease in long-term interest rates. It makes to so debt is cheap today, so why not borrow against tomorrow?
Credit demand collapses. There is only so much productive demand that need to be met. More credit becomes excessive and less beneficial to society as a result.
In a carry regime, inflation rates can be at a comfortable level then suddenly crash to deflationary measures. This is exactly what we have witnessed in the most recent CPI number that came out.
However, the carry regime doesn’t necessarily have to end.
If central banks can continue to increase money supply and accommodate the demand for cash while also increasing the sense that risks and debt are socialized, then the carry regime can carry on.
I believe we are nearing a time where central banks (1) understand the long-term ramifications of their actions or (2) keep pushing forward with easing policies until the ROI of those policies has diminished to nothing.
So, what’s the choice?
* Affiliate links help to support this blog. Amazon gives a small cut of each sale to me if you purchase through this link. Don’t click the link if you don’t want Amazon to pay me a referral fee.
